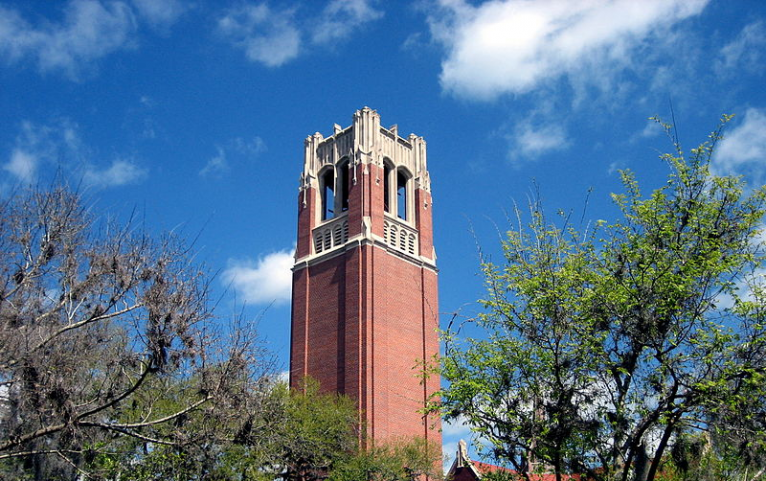
Two Florida Universities Name New Interim Presidents
The University of Florida and Florida A&M University, both of which recently saw their presidents resign, have appointed new temporary leaders. Read to learn more.
-
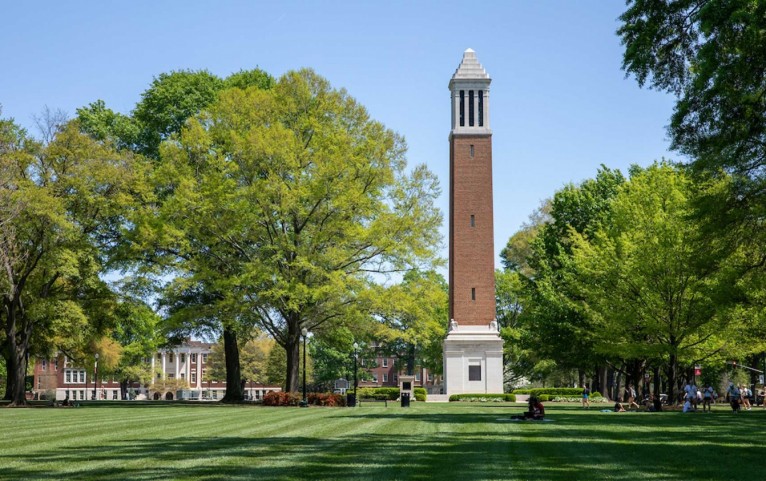
University of Alabama Scraps its DEI Department Amid New State Law
-

Pennsylvania State University System Chancellor to Resign This Fall
-
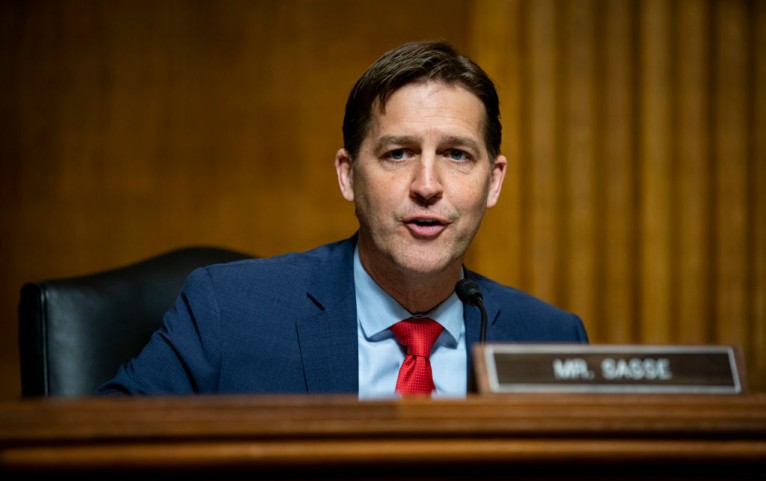
Former Senator Ben Sasse Resigns as University of Florida President, Citing Wife’s Health
-

Pastor Dino Rizzo Offers Advice for Young Church Planters
-
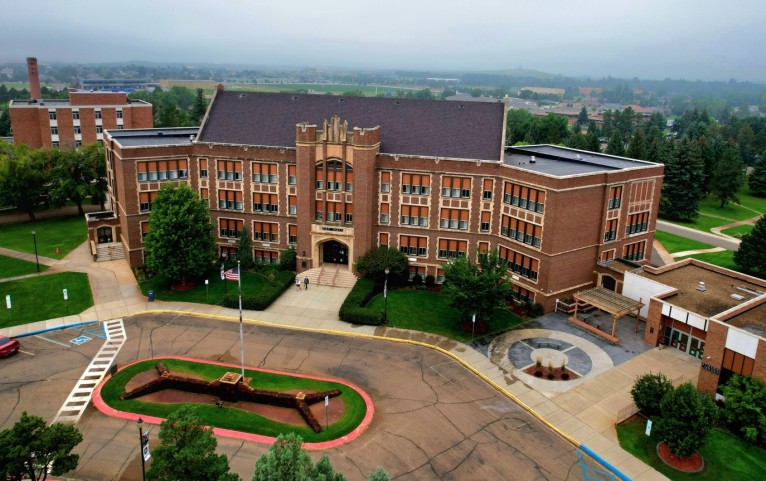
North Dakota's Dickinson State University President Resigns After Nursing Faculty Quit
-

Kentucky University Instructor on Leave Following ‘Offensive’ Trump Assassination Comments
-
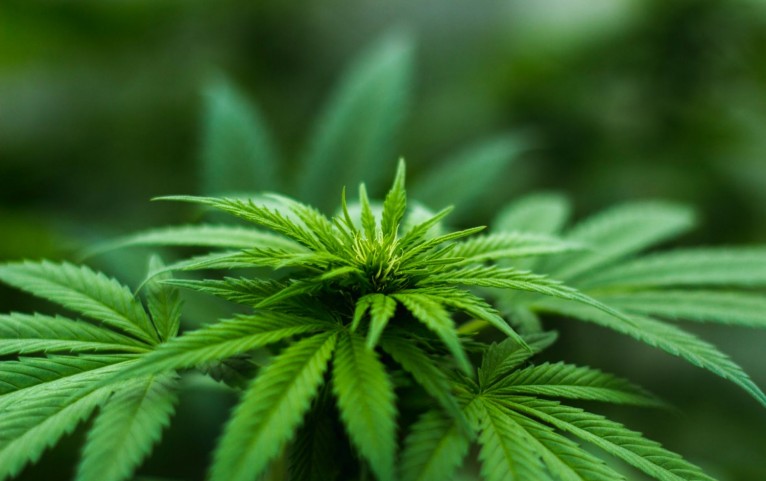
New Jersey's Stockton University to Offer State's First Undergraduate Cannabis Degree This Fall
By UNIVERSITY HERALD STAFF -
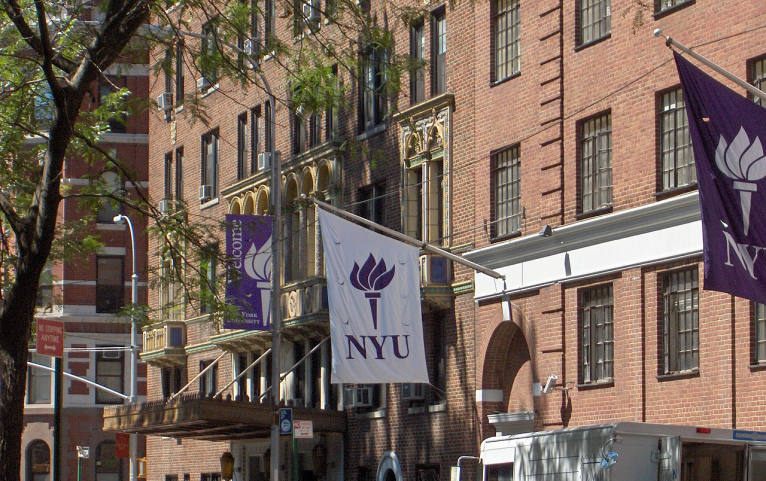
NYU Settles Lawsuit With Students Over Antisemitism Claims; University Expands Judaic Studies and Strengthens Ties With Tel Aviv University
By Joy Liwanag -

Trump's Republican Platform Agenda47 Proposes Radical Overhaul of Higher Education Policies
By Joy Liwanag -
Americans' Confidence in Higher Education Continues to Decline Amid Rising Concerns Over Political Bias and Cost [Poll]
By Joy Liwanag -
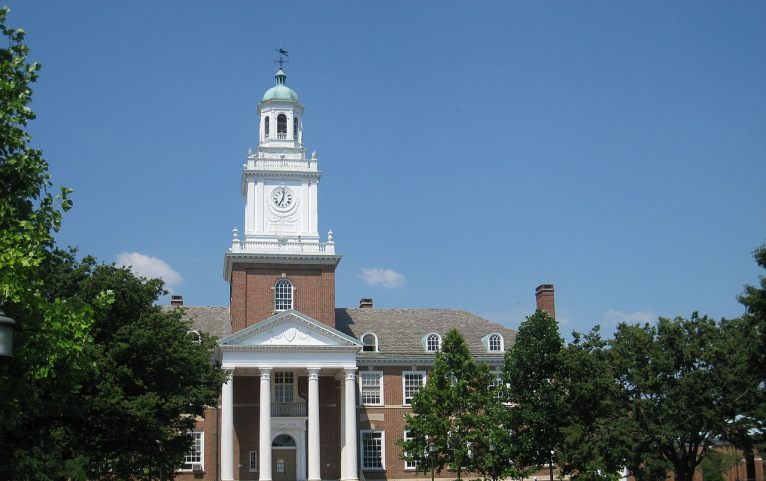
Bloomberg Donates $1 Billion to Make Medical Education Free at Johns Hopkins, Redefining Access to Healthcare Professions
By Joy Liwanag -
Lehigh University Expels Student Who Admitted to Forging Documents and Using ChatGPT To Write Essay for Scholarship; Concerns Over AI in Admissions Grow
By Joy Liwanag -

2024-2025 US News Best Global Universities Rankings Highlight Top Institutions Worldwide
By Joy Liwanag -
5 Inspiring Journeys: Stories of Uzbek Students at Top US Universities
By Joy Liwanag -

DEI Case Study: Black Student Pursues Medical Career Amid Program Debates
By Joy Liwanag -

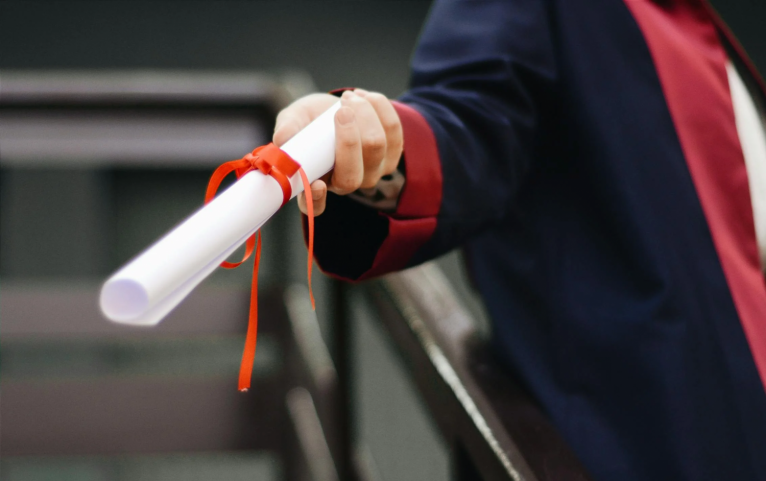
Rising Cost of a Bachelor’s Degree: Is It Worth the Investment?
By Joy Liwanag -

Law Schools Embrace AI Integration Amid Policy Uncertainty
By Joy Liwanag -

Vietnamese Manicurist, 55, Returns to University to Fulfill Lifelong Dream: Lessons on Academic Success From an Inspiring Woman
By Joy Liwanag